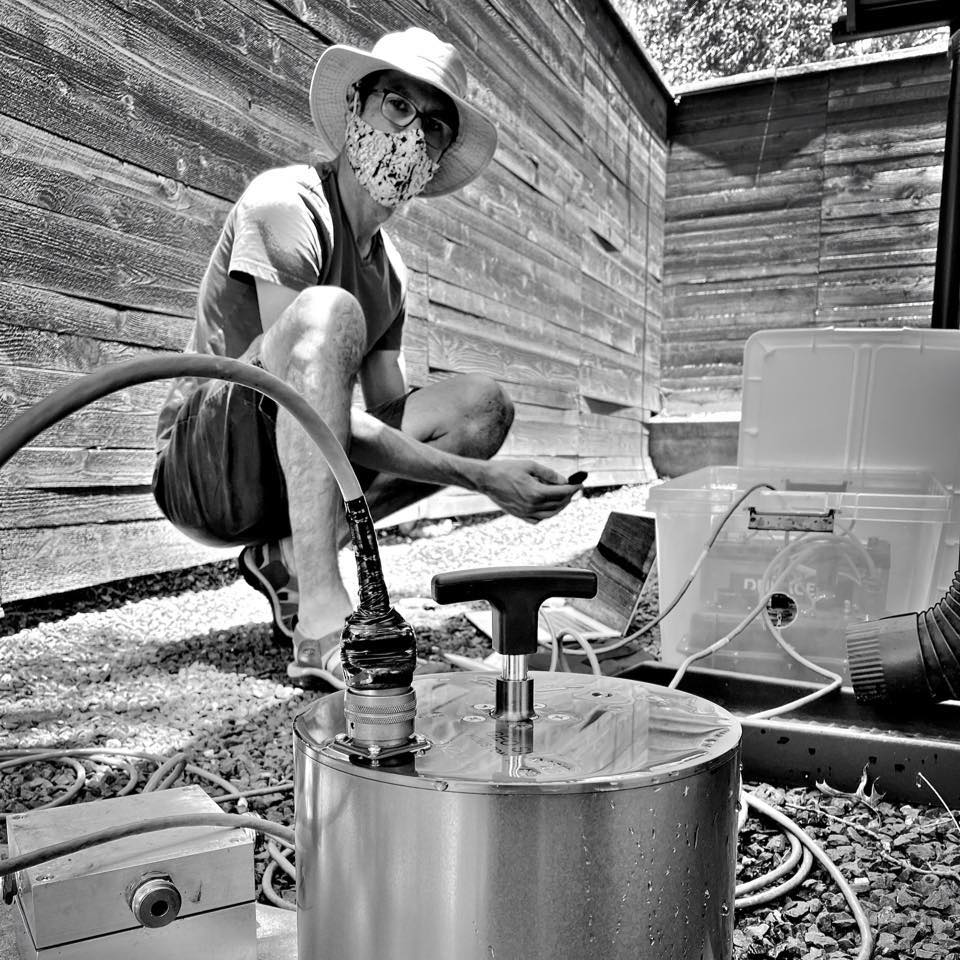
I wasn’t planning to spend a part of my summer lugging equipment around backyards in my neighborhood, but I guess most people’s summers haven’t exactly been turning out how they expected! After exploring changes in seismic noise with COVID-19 restrictions, I got interested in learning more about urban noise. In particular, there seem to be many open questions about urban noise that can potentially be explored using arrays of sensors, and combining seismic and infrasound measurements. So, I figured, let’s put out an array of sensors in Dallas and see what we see! (Note: to actually do this took much more work than anticipated, required the help of several people who lent and helped me field equipment, and is testing the patience of my wife with field equipment boxes stored at home.)
A challenge with putting out sensors in urban environments is finding secure locations. Fortunately, I live in a neat neighborhood with lots of cool people that have been willing to donate part of their backyard to me for a few weeks for this science experiment. Some folks are so dedicated to science that they’ve made exclusion zones around the sensors in their yards, others have tried to spoof me by generating their own ‘signals’ (ahem, Matt and Jack)! In all cases, however, I’m really grateful to them for helping me out by letting me in their yards.
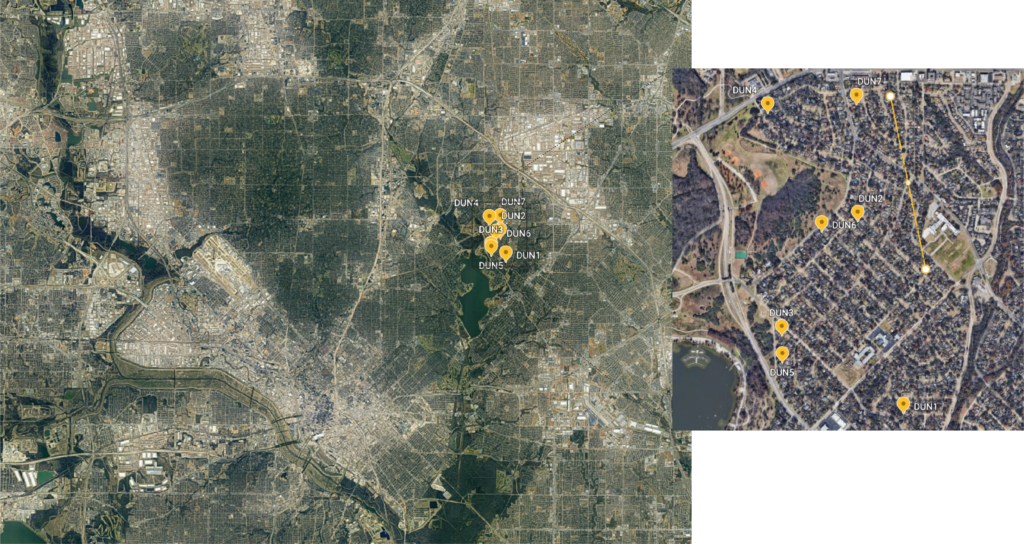
The sensor array, which I’m imaginatively calling ‘DUN’ for ‘Dallas Urban Noise’, is shown below. It’s in the Old Lake Highlands neighborhood of Dallas, which is a few miles away from downtown Dallas but surrounded by urban sprawl (and therefore potential sources of noise). Right now there are seven sites (DUN1-7) with plans to relocate a few of them in the next week to change the array configuration to a smaller aperture.
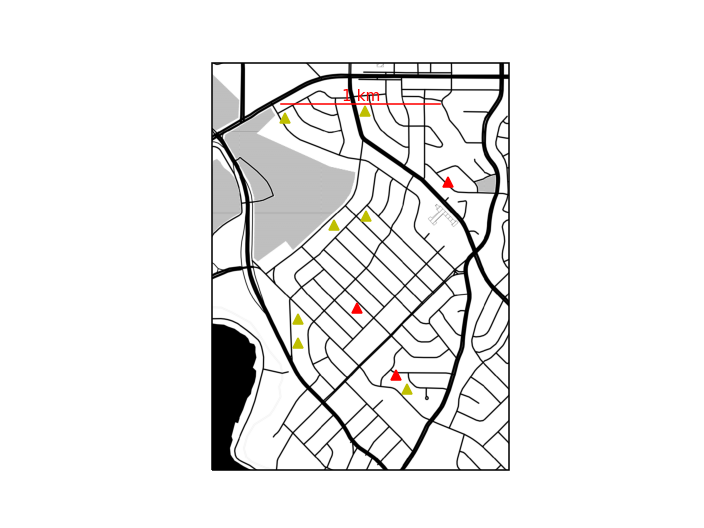
planned sites (red triangles).
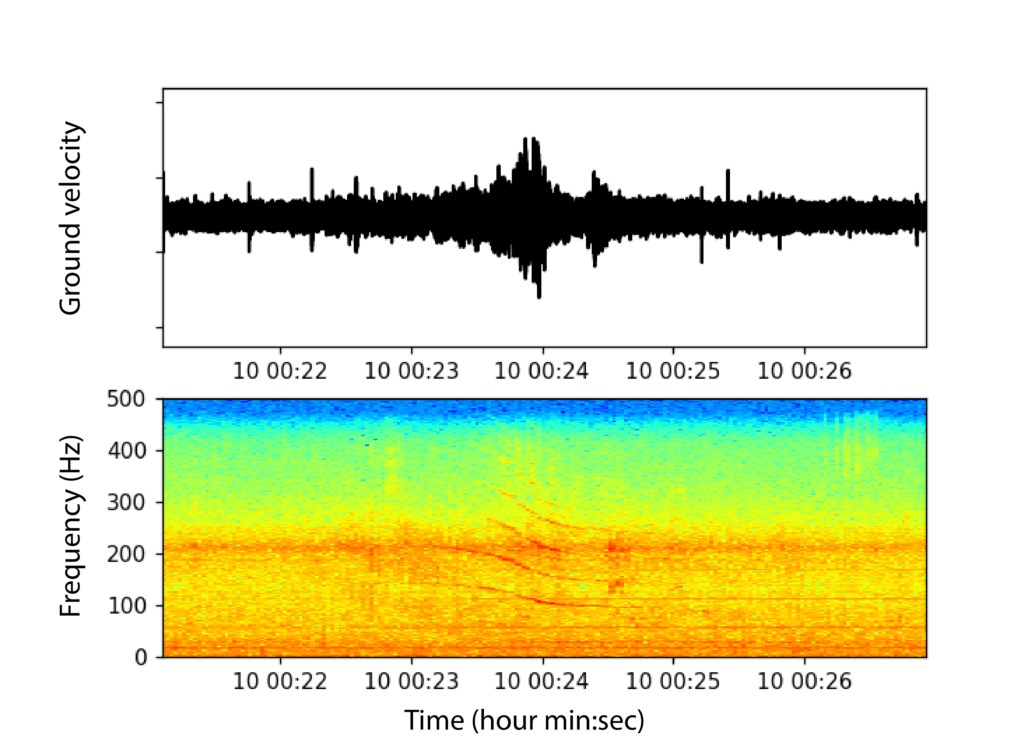
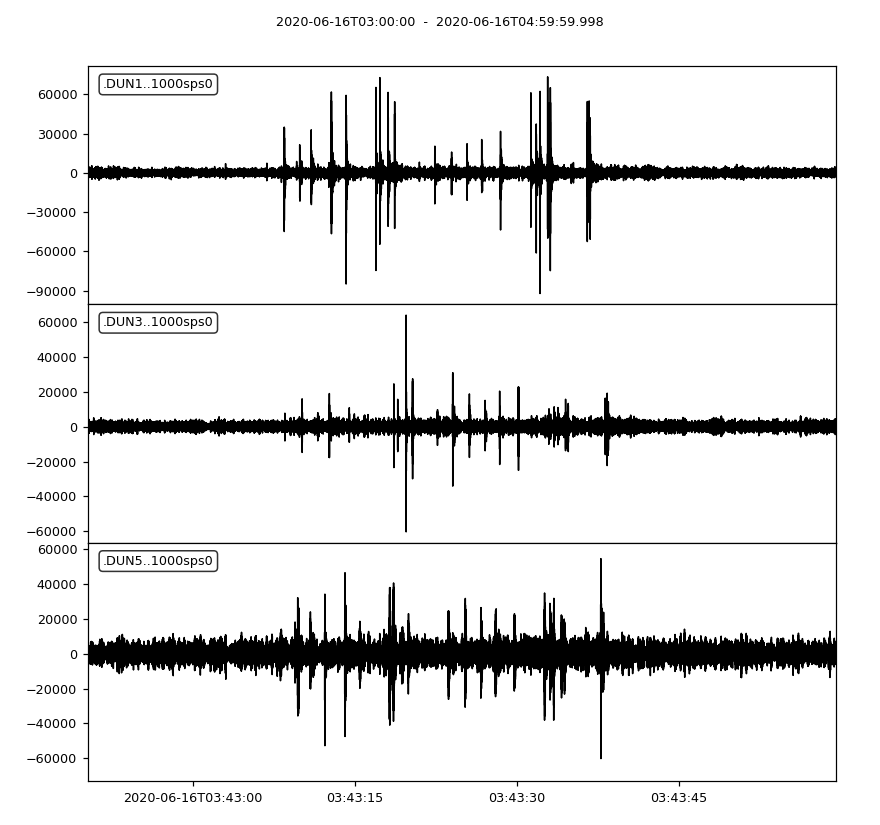
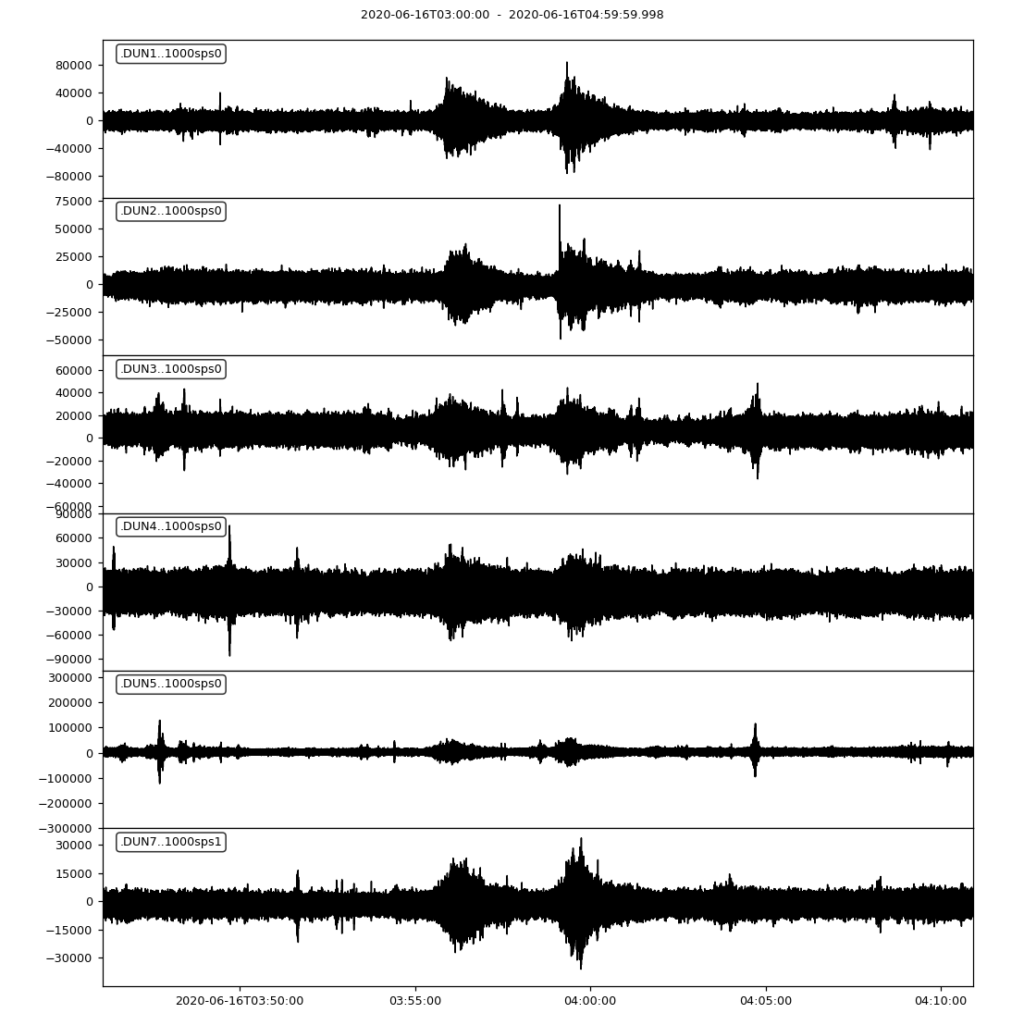
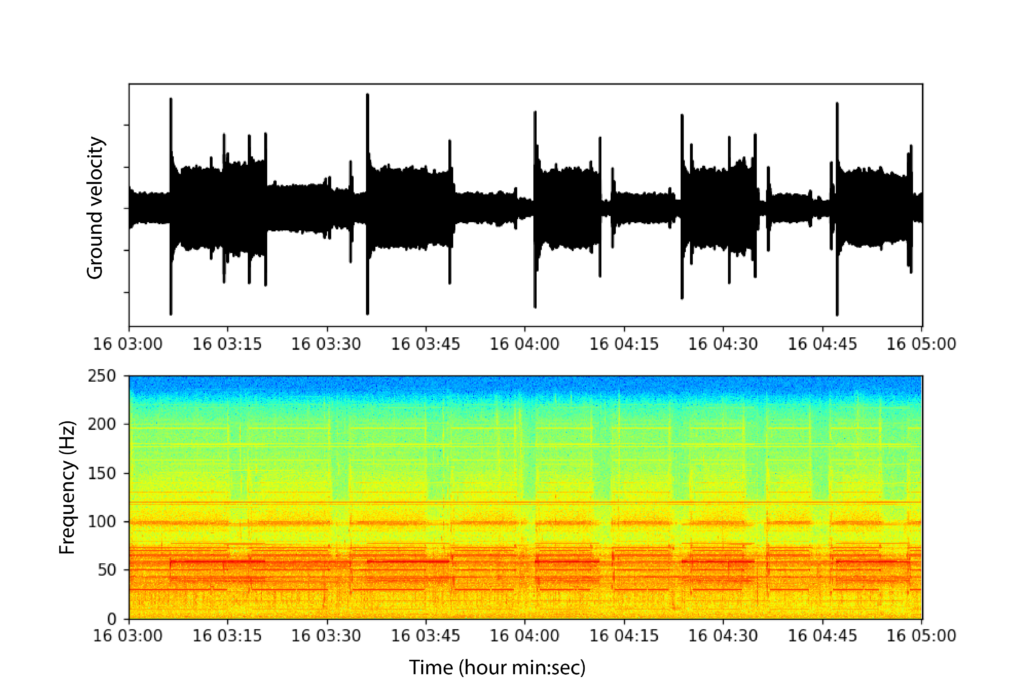
It’s going to take some time to trawl through this data and understand what it has to say, but a quick scan through some data collected yesterday shows that it is rich in many different types of signal. The most obvious, which Marie jokes is what the network is ‘optimized’ to detect, is A/C units. Unfortunately (or fortunately, depending on your perspective), A/C units are pretty hard to avoid in Texan backyards at this time of year. Other known sources detected include aircraft and fireworks. Many other unknown signals that are detected across the network are clearly present, and it will take some forensic analysis to figure out what caused them.